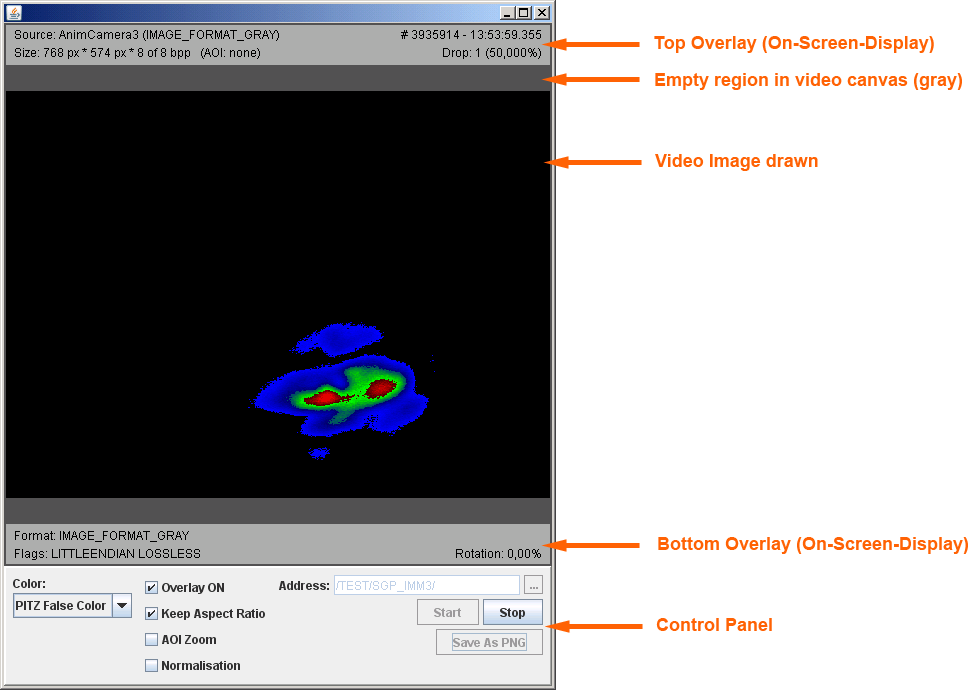
Fig: Screenshot of AcopVideoApplication
The AcopVideoApplication is a generic reference implementation of Java-based live video displaying meant to be used at basic physics particle accelerators. Its main purpose is to watch live video images just acquired at a so-called beamline. The following documentation is meant for users of the software in order to understand how it has to be operated and how it works. Some theory behind as well as implementation details are presented at the end of this manual which might be also interesting to experts.

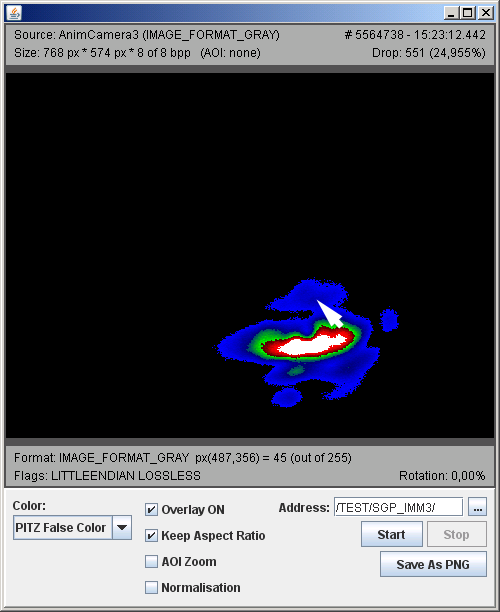
The screenshot shows an active AcopVideoApplication polling live video from an example image source playing back a previously recorded electron beam image animation from disk. On-Screen-Display is switched on permanently, so that the two grey transparent bars on top and bottom of the video area are shown at any time. Otherwise they are shown if the mouse is inside the video canvas (so-called on-demand mode).
On transferred image data, metadata is attached. Some of this is used to present additional information on the image, so-called image properties, onto the On-Screen-Display as shown. As one can see in top-left corner of it, the descriptive image source name is "AnimCamera3" and it originally delivered uncompressed grayscale data. The width of the video image is 768 pixel, height is 574 pixel. Eight (out of eight bits maximal) are used for encoding the luminosity (grayscale) signal. Indicated by "(AOI: none)", the image shown is not an Area of Interest (AOI)-image surrounded by a black frame. It can be assumed that the image size is the full size that was recorded at image source (ie. full camera scene).
On top-right corner, one can see that the image displayed had the unique image number 3935914 and was originally taken [1] today at 13:53:59.355 (Hour:Minute:Second.Millisecond) at server level. In the current uninterrupted live video display period (since "Start" button was pressed successfully), one image was dropped which means that 50% of all frames were dropped. [2] This is a very high number. The percentage drop count should be as little as possible if one wants to see every image in sequence as it was acquired at image source level. Usual causes of dropped frames are mainly limited computing power when acquiring or transmitting high frame rates or missing network or control system protocol bandwidth for transferring that huge amount of image data just-in-time.
On lower left corner the image format, as it was received at AcopVideoApplication, is shown. It is also grayscale video. Important characteristics of the image are that the image bits were encoded in little endian format and that the original source image data bits can be perfectly restored which is indicated by "LOSSLESS" tag. On lower right corner, the rotation is shown. That means, original source scene was not rotated at all for this example image and thus, orientation is the same as the camera saw it.
On control panel, it is shown that PITZ false colour display is selected. The beam image displayed is shown in PITZ false colours, accordingly. The On-Screen-Display (OSD) is permanently shown (Overlay ON is checked). Original aspect ratio of the video image is maintained (Keep Aspect Ratio is checked). No AOI Zoom is performed and normalisation (aka histogram equalisation, aka contrast enhancement) is not enabled. The transfer is currently running (Start and Save buttons are disabled, Stop button is enabled and Address cannot be changed).
The abbreviated address for the image source is "/TEST/SGP_IMM3", where TEST is TINE context and SGP_IMM3 is TINE server name. The TINE device (here: "Output") and TINE property (here: "Frame.Sched") are automatically appended and cannot be seen.
| [1] | Taken is not very descriptive here as we are playing back an animation from disk and the time shown is the time the image was selected out of the animation on disk at server level before send out to the AcopVideoApplication. |
| [2] | Please note that the screenshot taken is not very descriptive for dropped frames. Because if just 1 frame is dropped and 50% of all frames were dropped means that just two frames were received since monitoring of live video has started, which was just a second ago. |
After startup, the application's video display window shows a splash screen which is loaded from a custom png file called splash.png, which
must be placed in the current directory to be found. Otherwise, a pure black frame is internally generated and selected
as splash screen. Using a custom file splash screen* is a very easy way to "brand" the AcopVideoApplication to the facility.
As next step, one should enter a proper video address by hand in the address field. An alternative to typing is also
possible. One should press the button labeled "..." right beside the address field in that case. An ACOP Chooser panel
is shown and one can look up video (image) source feed addresses, usually exported as a control system protocol property,
in a very convenient way. General address structure is described in more detail in the next section.
| * | Please refer to Section 4 (Features explained) for more information. |
The address that one can type in by hand in the Address edit field can be a partial or a fully qualified TINE address. A fully qualified TINE address is a wellformed string like "[/tine_context/]tine_server_name/tine_device_name/tine_property_name". If the tine_context part, outlined in brackets, is omitted, the server is assumed to be found in the DEFAULT context. A partial TINE address consists of TINE context, TINE server name and TINE device name. Context and device name are optional and can be omitted. The following string specifies the layout: "[/tine_context/]tine_server_name/[tine_device _name]". In most simple case, only the TINE server name plus a slash has to be typed, but usually context and server name have to be specified.
In case of AcopVideoApplication, the latter part of a fully qualified address (TINE device name and TINE property name) is not used and stripped off! So any address will be cut down to a partial address. This is because video servers (Video System v2 (VSv2)) and video image sources (Video System v3 (VSv3)) follow a TINE naming design schematic. Using the partial or partialized address, before startup it is checked whether the TINE server can be contacted and what image streams (VSv3 or VSv2 or both) can be taken from. VSv3 stream is preferred always. VSv2 stream is used in case no VSv3 stream could be found. Generally speaking, one can connect the AcopVideoApplication flexibly to any VSv2 server or VSv3 image source. More information can be found in Section 3 (Image sources).
2.3 Starting transferAfter a valid address has been entered by one of the two methods outlined above, one should press the Start button. If start up was successful, Start button should become grayed out and Stop button should become enabled. In addition, address field is locked and saving to png is not possible. One should see live video coming in shortly after. If it does not appear, an error message should be shown. If no error message is shown and "Start" button is disabled, the image source is currently not delivering any video image, but the permanent connection has been established.
2.4 Optimizing displayed imageIn order to optimize the image quality displayed, certain options are available. One can enable, disable or change them on control panel. All changes performed automatically update the image shown in the video canvas, even in stop mode.
Saving a still image currently shown is possible by pressing the button "Save as PNG image...". The button can only be operated in stop mode, so any running Live display must be stopped before. In case no error message appears after one has entered a filename, the png file is saved successfully to disk. In addition, a text file with all image properties (like values shown in On-Screen-Display and other technical information) is saved accordingly. If the png file is called "brightbeam.png", the text file will be placed in the same directory and named "brightbeam.txt".
2.6 Value under cursorIf one wants to know the value of the pixel below the mouse arrow, one has to move the mouse inside the video canvas and press and hold the left mouse button. As long as the mouse button is pressed, one can move the mouse arrow to get to know image's pixel values below. One should note that image manipulation routines applied before, like normalisation, are altering the value that will be displayed. This is WYSIWYG! The "value under cursor" feature is used best if Overlay ON is checked so the On-Screen-Display is always shown, because position and value of pixel under cursor will be shown on OSD only. The following screenshot shows the feature in action. Note that the left mouse button must be kept pressed.
The AcopVideoApplication accepts any grayscale data input that can be delivered by VSv2 and VSv3 sources. In addition,
HuffYUV compressed grayscale images in VSv3 and VSv2 fashion can be decoded. Colour images are accepted in raw RGB and
JPEG encoded format.
As there can be much more formats transferred using VSv3, not any combination will be possible to
display inside the video canvas. In addition, due to lack of good implementation on remote peer (image provider) or
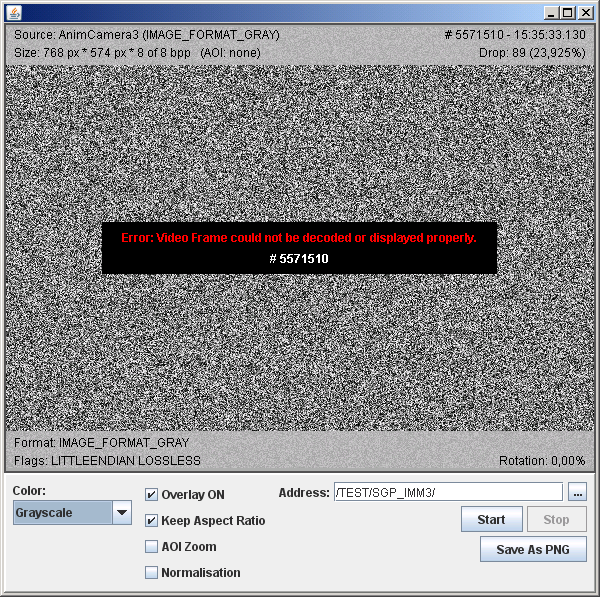
error on transmission, the header might be faulty and the whole image will be rejected. In order that the user knows this,
an error screen will be shown instead. As error screen, either a generated image ("paused random white noise") is shown or
a user-generated file loaded from disk at startup ("error.png") is shown instead. In addition, a special message is
embossed inside the error screen to outline that the original frame was bad and rejected.
If luminosity data (IMAGE_FORMAT_GRAY) is displayed, the colour magenta might be shown in addition somewhere inside the video image. Magenta is not part of greyscale, PITZ or MatLab Jet or any other future false colour table, but outlines that the pixel value is out of bounds and thus treated as illegal pixel value. For example if a camera delivers 12 bits per pixel these are marshalled into a 16 bit word in order to be able to transport and work on the data more efficiently. As shown on the figure, there are certain values of the 16 bit word which are no pixels and must not be found inside the video data. If they are found anyhow, something must be wrong. In order to show this to the user, magenta colour is used to paint these bad pixels so that they are very easily recognizable.

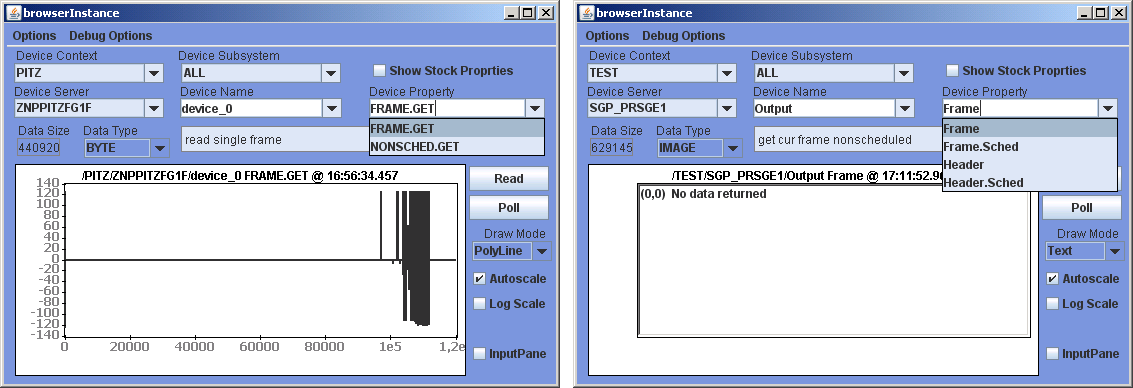
The AcopVideoApplication supports two different TINE image sources. First one is the proprietary VSv2 data format, which
consist of a header of fixed size plus image bits, glued together and transferred as byte array. Properties delivering such
data are usually named "FRAME.GET" and "NONSCHED.GET".
The second one is based on an agreed header format plus appended frame bits, which is known as VSv3 transport layer.
Transport layer is integrated into TINE as CF_IMAGE datatype. Properties delivering new standardized data are named "Frame.Sched" and "Frame".
For both Video Systems, a style of server naming and property structure was designed. On VSv2, the following outlined structure is used:
| TINE naming part | VSv2 Example | Fixed, Arbitrary or Maintainer's choice | Remarks |
| Subsystem | n/a | A | undefined, should not be used for naming lookup |
| Context | PITZ | M | context of the facility |
| Server name | ZNPPITZFG1F | M | uppercase machine dns name (znppitzfg1) and append F for Frame delivery |
| Location | device_0 | F | always "device_0" was used at VSv2 |
| Property | FRAME.GET, NONSCHED.GET | F F | scheduled property nonscheduled property |
| TINE naming part | VSv2 Example | Fixed, Arbitrary or Maintainer's choice | Remarks |
| Subsystem | Video | F | can be used for naming lookup (experimental) |
| Context | PITZ | M | context of the facility |
| Server name | SGP_PRSGE1 | M | no special naming rule exist at the moment |
| Location | Output | F | general image output device must be named "Output" |
| Property | Frame.Sched, Frame | F F | scheduled property nonscheduled property name |
Both property examples in the tables are shown on the following screenshot of Java Instant Client. Please note that type CF_IMAGE of VSv3 is not yet fully integrated into Java Instant Client!
This section provides introduction, in-depth detail and background knowlege regarding certain features of the program. It is meant for users as quick reference as well as people interested in details and theory behind.
4.1 Splash screen
On starting up of the application, a splash screen is loaded from disk, if a file "splash.png" can be found in the current
directory. Using Java built-in image loading, the png file is transferred into a color buffer and marshalled inside a
header structure that it looks like a VSv3 frame. Even if the splash.png is of indexed colour, it is not transformed to
grayscale at all, but at any time to full RGB colours.
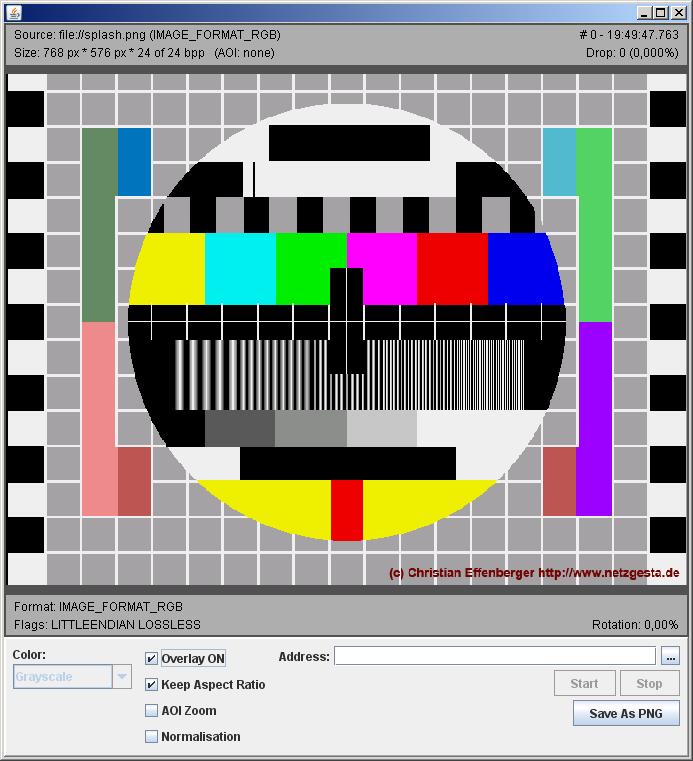
As an example, the following screenshot was made using an image taken from the www which shows a basic analogue TV test
screen. Other possible choices are a headline plus chart of the machine or just a few lines of text. It is up to the
maintainer what will be put there. If no png file will be put at all, a built-in 'black frame' (no luminosity) is used
as startup image.
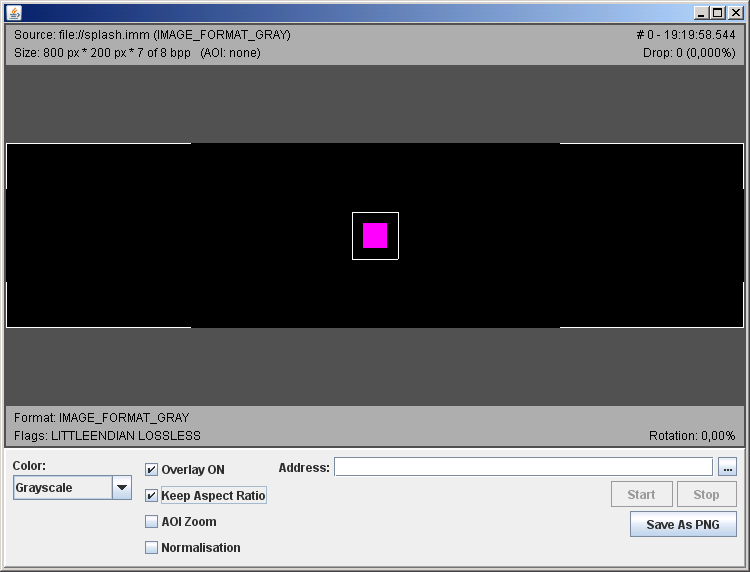
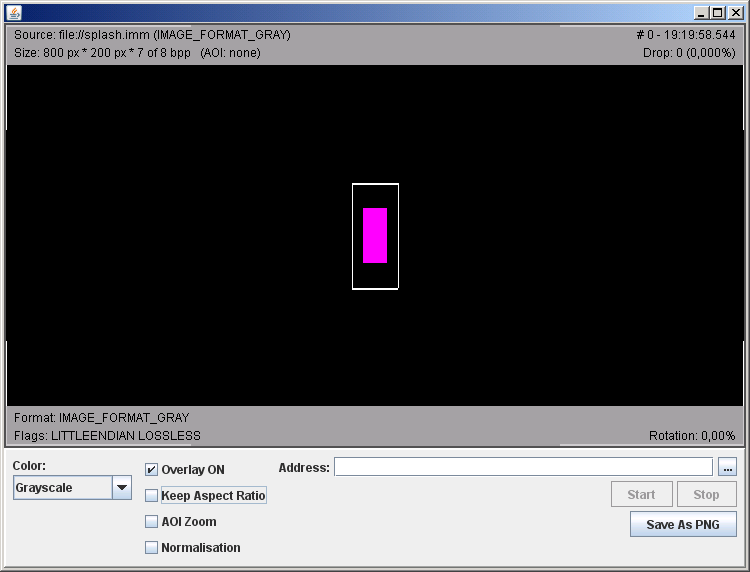
Apect ratio is a helpful feature to maintain relation of width vs. height of the source image on display. I simple terms it means that if one pixel is defined to be (and recorded as) a geometrical square, it should also be drawn as a geometrical square. The effect of incorrect aspect ratio is known for general TV and movies under the simple term "conehead", coming from the generally accepted size relations of a human head being exhausted by badly maintaining correct aspect ratio on display. The following two screenshots show a test image where this can be seen very well. Displayed correctly, the magenta "bar" and the white outline around should be geometrical squares. On the lower screenshot, aspect ratio is taken into account and the magenta square and the white square outline are displayed correctly.

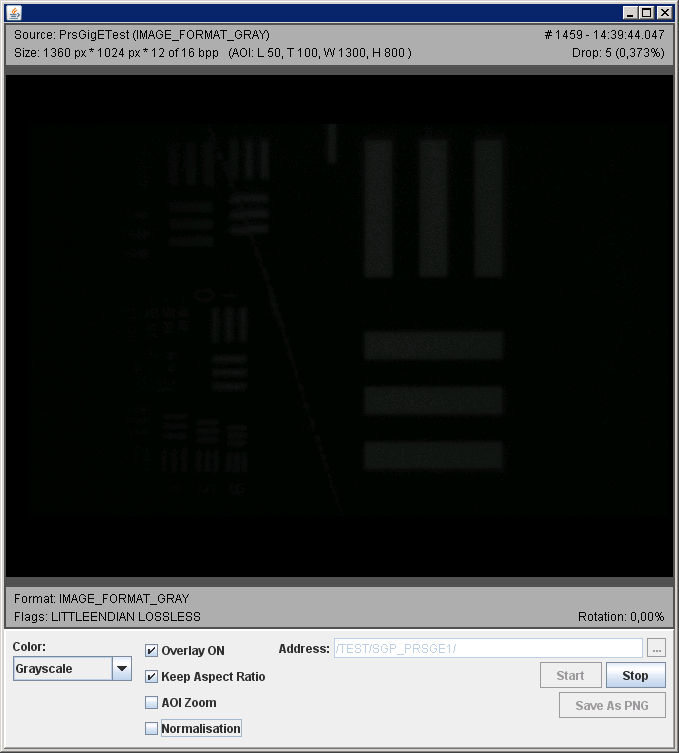
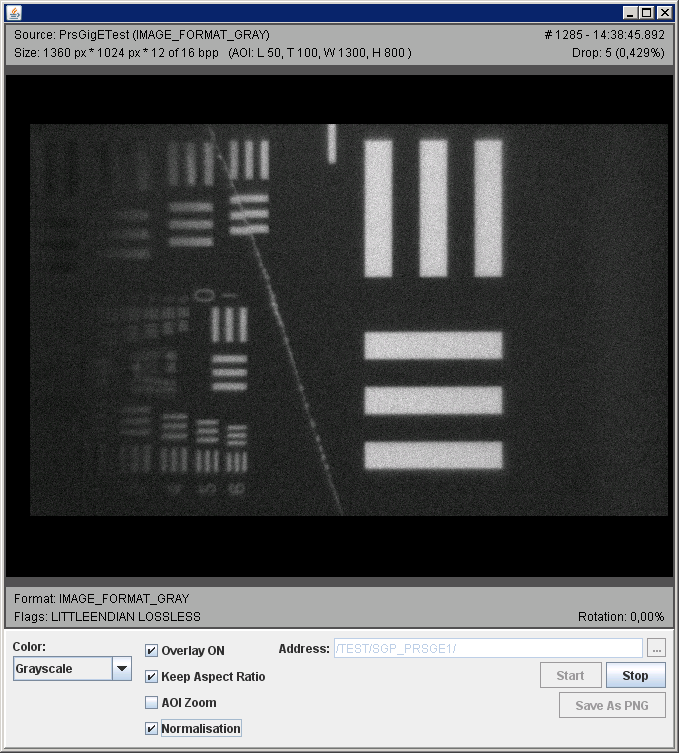
In normalisation mode, local contrast might be enhanced on colour as well as greyscale (luminosity) image data. For theory on normalisation as well as the applied algorithm, please take a look at Wikipedia on histogram equalisation. The Wikipedia article snapshot, attached as PDF, was briefly evaluated for correctness and gives a good overview. To visualize the effect of the algorithm, a practical scene showing a slice test grid is shown with and without applied histogram equalisation. Using a digital camera, the scene was acquired in very low light condition. The second image shows the effect of histogram equalisation that is applied if normalisation is switched on. Both screenshots show exactly the same source scene at equal light level.
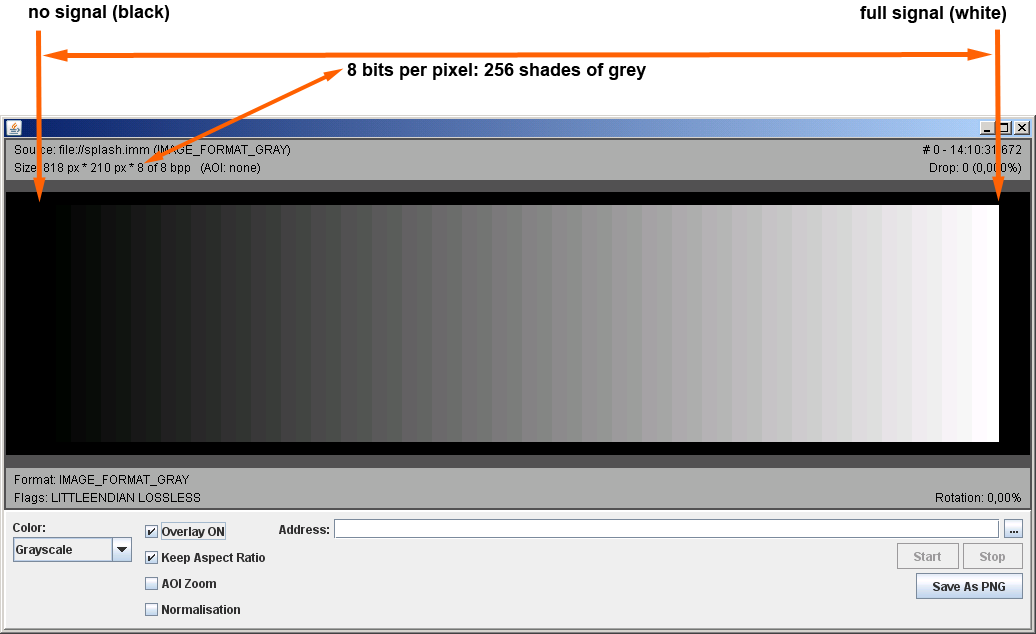
Luminosity digital data, more abstract defined as 1-dimensional discrete signal in longitudinal space, consist of equidistant steps of luminosity, which are linearly scaled from no luminosity to full luminosity. The amount of steps from "no" to "full" is not defined in analogue terms. In digital term, the signal resolution is defined by the number of significant bits. When talking about greyscale, 8 bit means that 256 shades of grey from black to white can be encoded. Using 16 bits, 65536 shades of grey can be encoded.
Perception of greyscale images can be tricky for humans. Even worse, displaying hardware like CRT monitors and TFT displays tend to have a limited grayscale resolution. Problems may arise if the size of a weak beam spot needs to be precisely estimated, if image quality (e.g. contrast) shall be examined or subtle differences between nearby regions need to be compared. As a practical example on electron beam monitoring, this leads to problems that edges of a beam shape cannot be recognized very well, because they tend to vanish in the surrounding darkness (black) of no signal. In addition, certain, maybe important information, e.g. whether there are regions of just no signal (black in greyscale) or regions of just full signal (white in greyscale) shown is hardly possible to recognize, because it vanishes in almost-black or almost-white regions nearby. False colour mappings, i.e. a relation of luminosity to a dedicated colour (or colour intensity) can help to improve that situation. On the other hand, greyscale display is a good way to manually evaluate and adjust sharpness and contrast levels if a real scene is acquired by camera and optics. If optics before a camera have to be aligned and focused, greyscale mode was proven to be very useful. To provide various modes of false colour mapping, the user may choose the one that fits best his current needs. One has to know that false colour mappings are only available if luminosity (1 dimensional signal) data is displayed. On colour source images, these mappings are NOT provided. Having false colours as well as greyscale mapping available, it is intuitive to
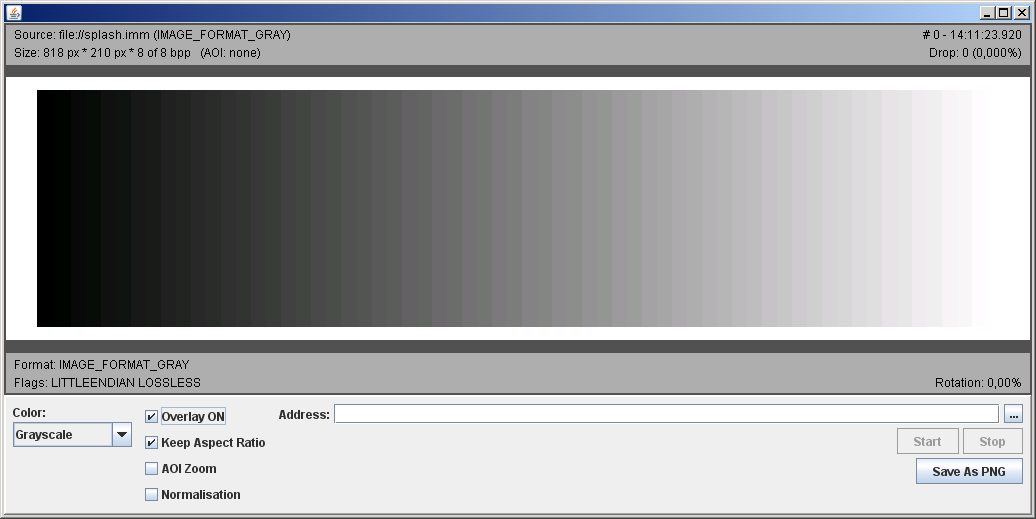
Three false colour mappings are implemented inside the AcopVideoApplication. First one is basic linear greyscale mapping. No signal is black, full signal is white and in between there are equidistant shades of grey. Greyscaling, as well as other false colour modes, are stretched/squeezed based on the number of effective bits the video signal has. For example for 8 bit effective resolution of the signal, 256 steps are used. For 12 bit effective resolution, 4096 steps are used accordingly. Please note that when being displayed, the greyscale resolution is limited to what the application and the displaying device supports. This application provides 8 bits on display. Office TFTs can be worse than seven bits!
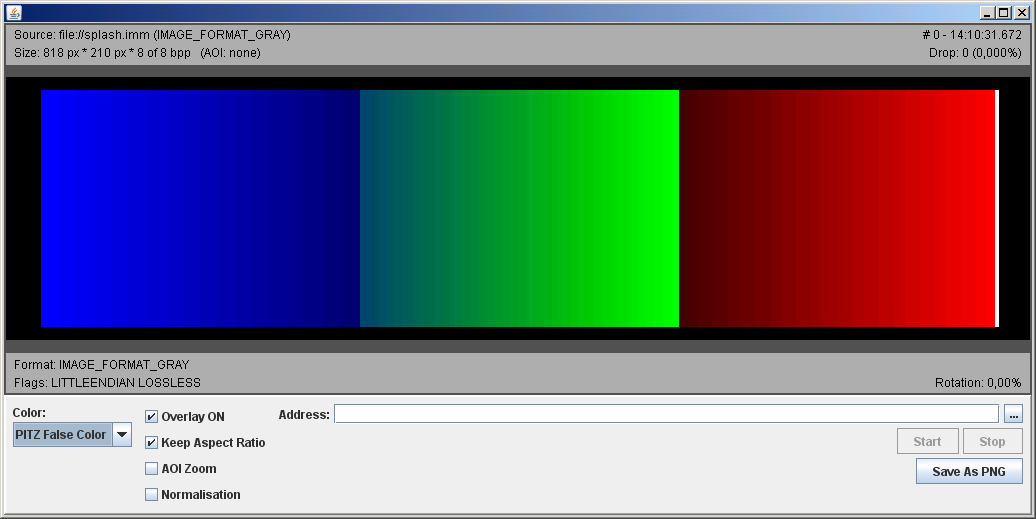
The second false colour table is called "PITZ false colours". It was originally invented at PITZ in the year 2002 by Velizar Miltchev. Its main purpose is that one can easily recognize the difference between no signal (black), full signal (white), weak signal(blue), medium signal(green) and strong signal(red). To avoid any misunderstanding, when cross-fading from dark to bright, the series is black->blue->green->red->white.
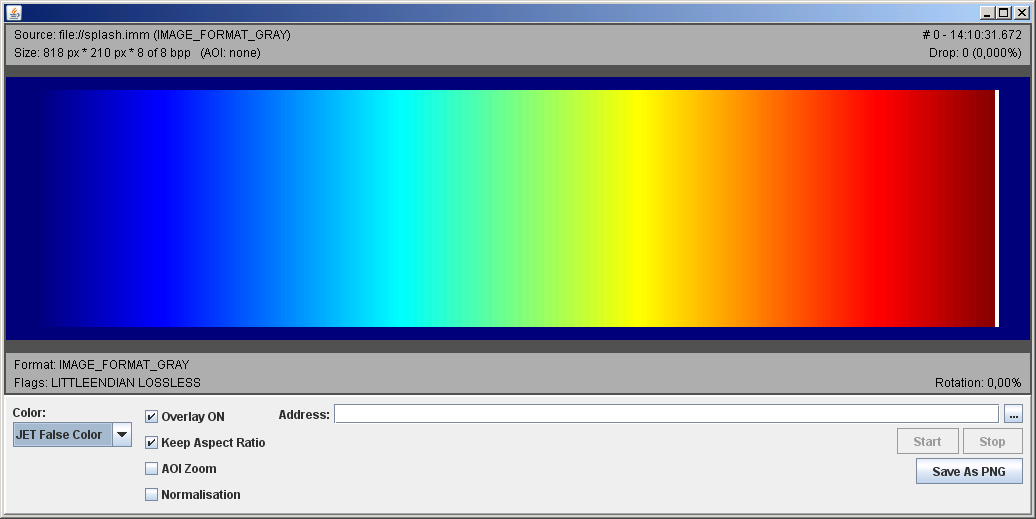
The third false colour table is called "JET false colours". It was originally taken from MatLab and so the name (Jet) was taken from MatLab, too. The full scaling can be seen on the screenshots appended to this section.
In order to visualize the ideas just mentioned, screenshots of a unique "luminosity bar test image" were taken using all three mentioned mappings. It consist of 256 equidistant steps which are shown as greyscale (from black to white, surrounded by no signal->black and from black to white, surrounded by full signal->white for full recognizability), PITZ false colours on no signal and MatLab JET on no signal background.
On VSv3 transfer, the image data delivered via the connection can be just a part of the whole image source area only.
The reason to have this is that in certain cases only a part of the full recorded region is significant at all. The
rest of the image contents might be e.g. surroundings, reflections or instruments. On image transport side, it is
possible to define a rectangular region at server or hardware level and only the pixels contained inside this region
will be transferred further downstream at all. The rest of the image scene is either thrown away at hardware level or
at software level. On software level, it is conceivable that the outer part is not cut away, but used or stored elsewhere.
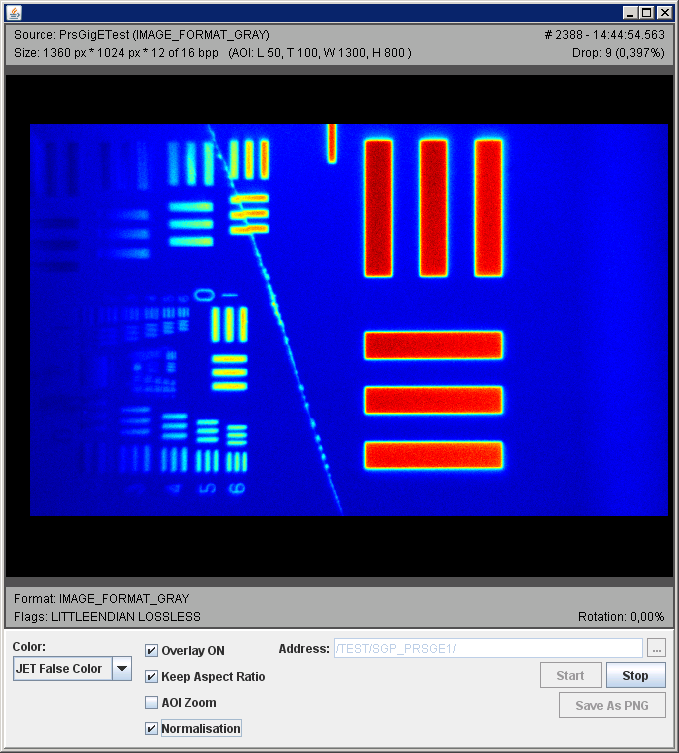
On the following screenshots, a scene featuring a slit test grid was acquired using a digital camera. Exemplary the
outer region of the full image (pixel size 1360x1024) was cut away at hardware level. In order to outline that there
was something cut away from the full camera chip view, a black rectangular shape is drawn around the area of interest.
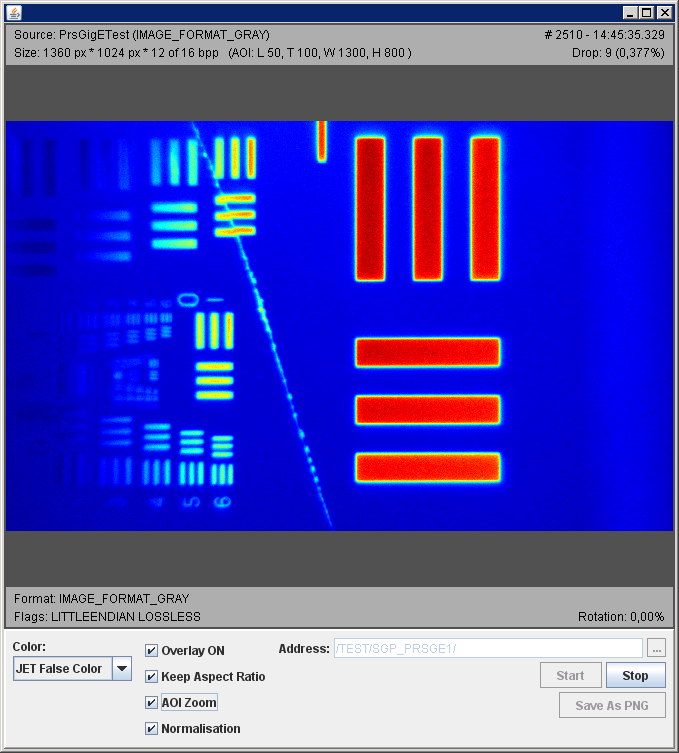
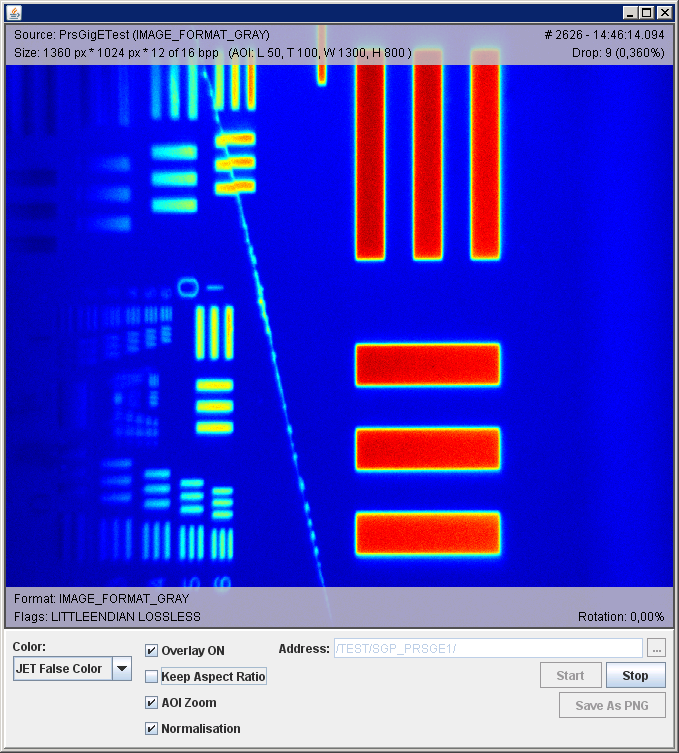
In order to remove this rectangular region on drawing and just concentrate on the inner area of interest, AOI Zoom
feature was implemented. On the following three screenshots, the same source scene is shown, just displaying method is
different.
