AcopChart
|
Acop Chart Example
| Use the ACOP Chart for many kinds of data display.
You can plot spectra of data, histograms, trends, gantt displays, etc. as well as annotate the plot area with display text. Supply chart legends and axis labels to suit your needs.
The ACOP chart offers various fitting and analysis functions of the displayed data, such as FFT, Gaussian fits, etc.
Plotting 3-D data will soon be available.
|
|
Acop Chart general display Properties
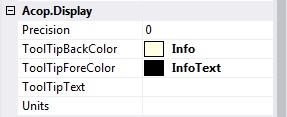
| Precision gives the precision of floating point numbers in the chart if the PlotMode = Text or if the PrintText() method is used to print text values onto the chart.
ToolTipBackColor specifies the background color to use in tool tip text when the mouse hovers over the chart.
ToolTipForeColor specifies the foreground color to use in tool tip text when the mouse hovers over the chart.
ToolTipText specifies the default Tool Tip Text to use for the chart. This will also be the tool tip text displayed when the mouse hovers over the chart frame in cases where AutoMouseMoveToolTipText is true.
Units specifies the default units to use for the data drawn in the chart. If there are no default units and AutoLinkUpdate is used in conjuction with LinkAddress and LinkProperty then ACOP will attempt to discover the property units for the displayed data.
|
|
Acop Chart Display Axes Properties
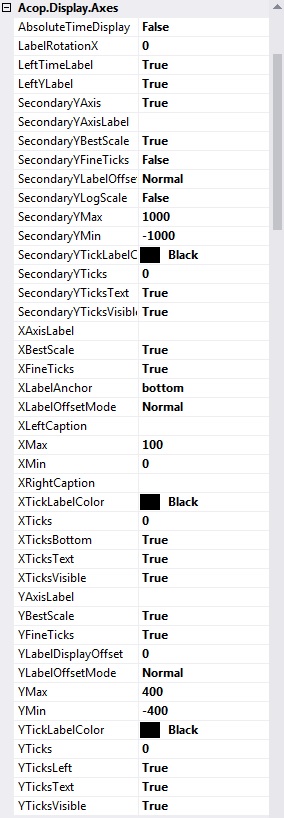
| AbsoluteTimeDisplay if true displays absolute time as tick mark labels for a TIME_LIN or TIME_LOG display.
LabelRotationX specifies the text rotation to use for horizontal (X) axis tick mark labels.
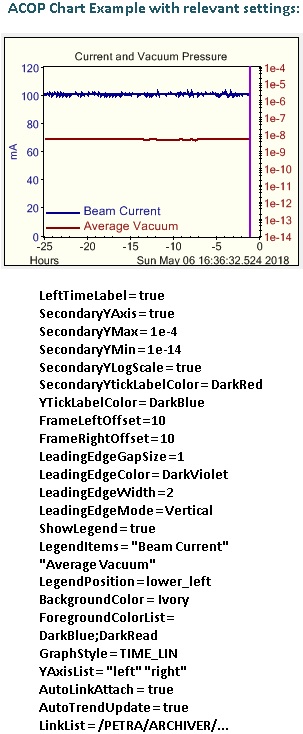
LeftTimeLabel if true shows the absolute time on the left in a TIME_LIN or TIME_LOG plot.
LeftYLabel if true makes the left-side Y-axis label visible
SecondaryYAxis if true makes the secondary Y-axis visible.
SecondaryYAxisLabel specifies the label to use on the secondary Y-axis.
SecondaryYBestScale if true apply the nearest order of magnitude max/min settings to the secondary Y-axis.
SecondaryYFineTicks if true makes right-hand side vertical (secondary Y-axis) sub (fine) tick marks visible on the display frame.
SecondaryYLabelOffsetMode adjusts axis tick labels to account for large but insignifcant common offsets. Does not adjust data! (see XLabelOffsetMode for settings)
SecondaryYLogScale if true makes the secondary Y-axis use a log scale
SecondaryYMax Specifies the secondary (right-hand side) Y-axis display maximum.
SecondaryYMin specifies the secondary (right-hand side) Y-axis display minimum.
SecondaryYTickLabelColor specifies the color to use for the secondary Y-axis tick labels in the display frame.
SecondaryYTicks the number of right-hand side vertical (secondary Y-axis) tick marks visible on the display frame. Any number less than 1 instructs ACOP to choose the best number of tick marks (default = 0).
SecondaryYTicksText if true shows the right-hand side vertical (secondary Y-axis) coordinate next to a tick mark.
SecondaryYTicksVisible if true shows tick marks on the right-hand side vertical (secondary Y-axis).
XAxisLabel specifies the label to use on the X-axis.
XBestScale if true applies the nearest order of magnitude max/min settings to the X-axis.
XFineTicks if true makes horizontal (X-axis) sub (fine) tick marks visible on the display frame.
XLabelAnchor anchors the X-Axis label to the an area of the chart frame. This setting becomes relevant if a chart Legend is to appear inside the bottom frame area.
XLabelOffsetMode adjusts axis tick labels to account for large but insignifcant common offsets. Does not adjust data!
- Normal
- UseMinimum
- UseModular
XLeftCaption specifies a short text to use on the lower left X-axis.
XMax specifies the X-axis display maximum.
XMin specifies the X-axis display minimum.
XRightCaption specifies a short text to use on the lower right X-axis.
XTickLabelColor specifies the color to use for the X-axis tick labels in the display frame.
XTicks the number of horizontal (X-axis) tick marks visible on the display frame. Any number less than 1 instructs ACOP to choose the best number of tick marks (default = 0).
XTicksBottom if true makes horizontal (X-axis) tick marks visible along the bottom of the display frame.
XTicksText if true shows the horizontal (X-axis) coordinate next to a tick mark.
XTicksVisible if true shows tick marks on the horizontal (X-axis).
YAxisLabel specifies the label to use on the Y-axis.
YBestScale if true applies the nearest order of magnitude max/min settings to the Y-axis.
YFineTicks if true makes vertical (Y-axis) sub (fine) tick marks visible on the display frame.
YLabelDisplayOffset adjusts the postion of the Y axis label.
YLabelOffsetMode adjusts axis tick labels to account for large but insignifcant common offsets. Does not adjust data! (see XLabelOffsetMode for settings)
YMax specifies the y-axis display maximum.
YMin specifies the y-axis display minimum.
YTickLabelColor specifies the color to use for the Y-axis tick labels in the display frame.
YTicks the number of vertical (Y-axis) tick marks visible on the display frame. Any number less than 1 instructs ACOP to choose the best number of tick marks (default = 0).
YTicksLeft if true makes vertical (Y-axis) tick marks visible along the left of the display frame.
YTicksText if true shows the vertical (Y-axis) coordinate next to a tick mark.
YTicksVisible if true shows tick marks on the vertical (Y-axis).
|
|
Acop Chart Display Frame Properties
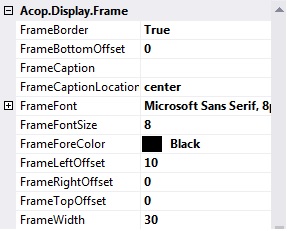
| FrameBorder if true (default) draws a visible border around the frame.
FrameBottomOffset specifies a postioning offset (positive or negative) to apply to the bottom of the display frame. e.g. add a positive amount to increase the frame width on the bottom of the display.
FrameCaption specifies the display frame caption (top margin).
FrameCaptionLocation specifies the relative position of the frame caption.
- left
- center (default)
- right
FrameFont specifies the font used in the acop frame.
FrameFontSize specifies the font sized used in the acop frame.
FrameForeColor specifies the forecolor used within the acop frame.
FrameLeftOffset specifies a postioning offset (positive or negative) to apply to the lefthand side of the display frame. e.g. add a positive amount to increase the frame width on the left of the display.
FrameRightOffset specifies a postioning offset (positive or negative) to apply to the righthand side of the display frame. e.g. add a negative amount to decrease the frame width on the right of the display.
FrameTopOffset specifies a postioning offset (positive or negative) to apply to the top of the display frame.
FrameWidth specifies the display frame width.
|
|
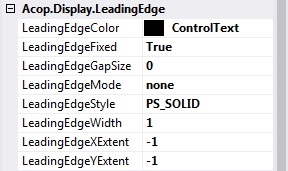
Acop Chart Leading Edge Properties
| LeadingEdgeColor specifies the color to use for the leading edge in the display frame.
LeadingEdgeFixed determines whether the leading edge is fixed (true) or moving (false)
LeadingEdgeGapSize specifies the gap size to use for the leading edge in the display frame (units of time axis)
LeadingEdgeMode cursor mode for the leading edge in an updating trend chart
- none
- horizontal
- vertical
- both
LeadingEdgeStyle Specifies the draw style of the leading edge in the display frame.
- PS_SOLID
- PS_DASH
- PS_DOT
- PS_DASH_DOT
- PS_DASH_DOT_DOT
LeadingEdgeWidth specifies the pen width a leading edge when the LeadingEdgeMode is not 'none'
LeadingEdgeXExtent specifies the horizontal width of a leading edge when the LeadingEdgeMode specifies a horizontal line
LeadingEdgeYExtent specifies the vertical width of a leading edge when the LeadingEdgeMode specifies a vertical line
|
|
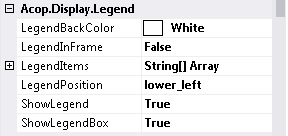
Acop Chart Legend Properties
| LegendBackColor specifies the legend box back color when ShowLegendBox = true.
LegendInFrame if true then the chart legend will appear inside the frame area of the chart, else it will appear within the chart. Note that the Frame offsets must be adjusted so that the legend fits entirely within the frame, etc.
LegendItems provides an array of plot descriptions to be used as a legend (if ShowLegend = true)
LegendPosition establishes the location of the chart legend
- upper_right
- upper_left
- lower_right
- lower_left
- bottom
- top
ShowLegend determines whether or not a legend should appear on the chart
ShowLegendBox specifies whether or not a legend box should appear around the legend or whether the legend should appear directly on the chart. Applies only when ShowLegend is true.
|
|
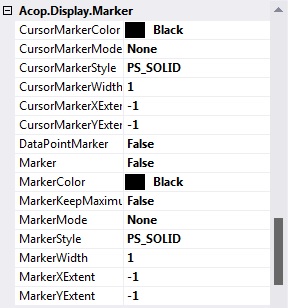
Acop Chart Marker Properties
| CursorMarkerColor specifies the color to use for the cursor marker in the display frame.
CursorMarkerMode specifies the cursor marker mode in the display frame. (see MarkerMode for options)
CursorMarkerStyle specifies the draw style of the cursor marker in the display frame.(see MarkerStyle for options)
CursorMarkerWidth specifies the width of the cursor marker in the displayed frame.
CursorMarkerXExtent specifies the horizontal (X) extent of the cursor marker (when enabled).
CursorMarkerYExtent specifies the vertical (Y) extent of the cursor marker (when enabled).
DataPointMarker if true then the drawn data at the cursor position will be hightlighted with a circle.
Marker if true activates the display marker for all displays showing. If set at design time in conjunction with MarkerKeepMaximum then display markers will appear. Else this property should be set programmatically when specific data markers are desired.
MarkerColor specifies the color to use for the marker in the display frame.
MarkerKeepMaximum if true specifies that the data marker follows the maximum data value upon each update.
MarkerMode specifies the data-point marker mode in the display frame (0 = none).
- None
- Horizontal
- Vertical
- CrossHair
MarkerStyle specifies the draw style of the marker in the display frame.
- PS_SOLID
- PS_DASH
- PS_DOT
- PS_DASH_DOT
- PS_DASH_DOT_DOT
MarkerWidth specifies the width of the data-point used marker in the displayed frame.
MarkerXExtent specifies the horizontal (X) extent of the data-point markers (when enabled).
MarkerYExtent specifies the vertical (Y) extent of the data-point markers (when enabled).
|
|
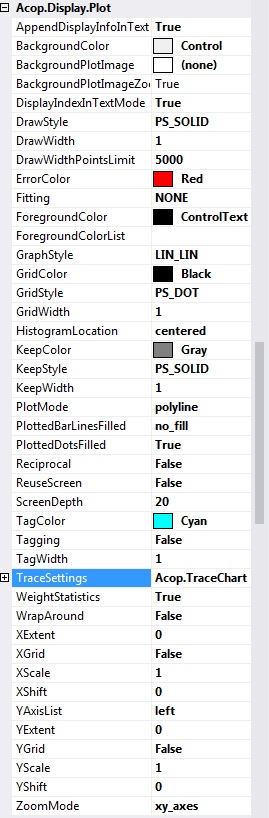
Acop Chart Plot Properties
| AppendDisplayInfoInTextMode if true accessing the Draw() method in 'textbox' mode will append the acop display number and array index number to the displayed data.
BackgroundColor specifies the background color to use within the display frame.
BackgroundPlotImage sets a background image into the plot area.
BackgroundPlotImageZoom activate or deactivate the zooming of the background image.
DisplayIndexInTextMode if true and the display mode is textbox the array element index will precede the contents of each string array element
DrawStyle specifies the draw style of the pen in the display frame.
- PS_SOLID
- PS_DASH
- PS_DOT
- PS_DASH_DOT
- PS_DASH_DOT_DOT
DrawWidth specifies the pen-width to use for plots in the display frame.
DrawWidthPointsLimit gets/sets the number of points at which the draw width automatically resets to '1'
ErrorColor specifies the color to use for error data in the display frame.
Fitting establishes the data operation or fitting to be applied to the Y-axis data.
- NONE
- FFT_SPECTRUM
- FFT_PHASE
- FFT_SPECTRUM_PHASE
- FFT_REAL_IMAGINARY
- FFT_REAL
- FFT_IMAGINARY
- FFT_INVERSE
- DIFFERENTIAL_STATISTICS
- INTEGRAL_STATISTICS
- LINE_FIT
- EXPONENTIAL_FIT
- GAUSSIAN_FIT
- PARABOLIC_FIT
- CUBIC_FIT
- QUARTIC_FIT
ForegroundColor specifies the foreground color to use within the display frame.
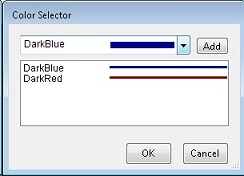
ForegroundColorList specifies a list of foreground colors to use in multiple plots. Color editor available at design time.
GraphStyle specifies the graph style in the display frame.
- LIN_LIN
- LIN_LOG
- LOG_LIN
- LOG_LOG
- TIME_LIN
- TIME_LOG
GridColor specifies the color to use for the displayed grid.
GridStyle specifies the draw style of the grid lines in the display frame. (see DrawStyle for options)
GridWidth specifies the width of the grid lines used in the displayed grid.
HistogramLocation the histogram location relative to the X-Axis (in histogram_rastering mode)
- left_adjusted
- centered (default)
- right_adjusted
KeepColor specifies the color to use for the 'kept' curves (during a 'Clear()' operation) in the display frame.
KeepStyle specifies the draw style of the kept curves in the display frame.(see DrawStyle for options)
KeepWidth specifies the width of the 'kept' curves (during a 'Clear()' operation) in the displayed grid.
NormalizePlottedData if true then data will be normalized from 0 to 100% prior to display.
PlotMode specifies the plot mode in the display frame.
- polyline
- barline
- histogram
- dots
- histogram_rastering
- rectangle
- circle
- textbox
- polyline_dots
- barline_dots
- histogram_dots
- histogram_rastering_dots
- barline_histo
- barline_histo_dots
- polyline_cross
- annotation
- status
- ganttplot
- barline_bit
- symbol
PlotSymbol is the character symbol to display when PlotMode = symbol (default : '+').
PlottedBarLinesFilled determines whether and how barline plots will filled.
- fill_below
- no_fill (default)
- fill_above
PlottedDotsFilled if true rectangles used in data-point plots will be filled with the assigned color.
Reciprocal if true the vertical (Y) axis data are inverted (1/y with zero check) on the display
ReuseScreen if true will discard (and later reuse the display handle) a display following a ClearScreen().
ScreenDepth deterimines the number of buffers in use for data drawn on the display
TagColor specifies the color to use for tagged data in the display frame.
Tagging if true designated data will be 'tagged' with the TagColor and TagWidth settings.
TagWidth specifies the pen width to use for tagged data in the display frame.
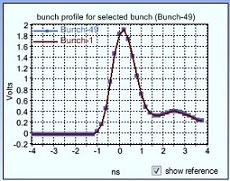
TraceSettings offers a sub grid menu for setting trace plot (typically an oscilloscope) parameters
- IsTrace if true specifies the plotted data as a trace signal
- ReferenceColor establishes the plot color for the trace reference
- ReferenceWidth establishes the plot width for the trace reference
- ServerSettings if true then the axis max and min settings will be determined by the link address endpoint
- ShowAve if true then the averaged trace will be displayed.
- ShowRef if true then the reference trace will be displayed.
- UseTrigger if true then the display will be updated at the trigger rate of the address endpoint
- XAxisExponent if not 'NONE' will attempt to convert the X axis to the desired units.
b WeightStatistics if true calls to GetYDataMean() or GetYDataRms() will apply X-interval weighting in determining the mean data value of the plotted data.
WrapAround if true allow plotted data to 'wrap around the display' when scrolling the display frame.
XExtent sets the horizontal extent of the data-point rectangles used when 'dots' are plotted.
XGrid if true apply a horizontal (X-axis) grid on the display frame.
XScale specifies a multiplication scale factor to apply to the X-axis values of the plotted array.
XShift specifies an additive shift factor to apply to the X-axis values of the plotted array.
YAxisList specifies list of Y-Axis settings ('left' or 'right') to which consecutive plots are bound
YExtent sets the vertical extent of the data-point rectangles used when 'dots' are plotted.
YGrid if true apply a vertical (Y-axis) grid on the display frame.
YScale specifies a multiplication scale factor to apply to the Y-axis values of the plotted array.
YShift specifies an additive shift factor to apply to the Y-axis values of the plotted array.
ZoomMode specifies the zoom mode of the display frame.
- none
- x_axis_unbuffered
- y_axis_unbuffered
- xy_axes_unbuffered
- x_axis
- y_axis
- xy_axes (default)
|
|
Acop Chart Text Properties
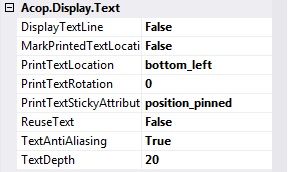
| DisplayTextLine if true a vertical line is printed at the text location in the display frame.
MarkPrintedTextLocation if true Text displayed in the chart with the PrintText() method will mark the origin of the text with a vertical line.
PrintTextLocation specifies the relative text location for text printed on a chart with the PrintText() method.
- bottom_left
- bottom_center
- bottom_right
- mid_left
- mid_center
- mid_right
- top_left
- top_center
- top_right
PrintTextRotation specifies the text rotation to use for the text printed on the chart via calls to PrintText().
PrintTetxtStickyAttribute specifies the pinned behavior and zooming-scalability for text printed on a chart with the PrintText() method.
- position_pinned
- y_pinned
- x_pinned
- scalable_unpinned
- unscalable_unpinned
ReuseText if true will discard (and later reuse the text handle) a display following a ClearText().
TextAntiAliasing if true it does something and no one is sure what ...
TextDepth specifies the number of text buffers in use for text printed on the display
|
|
Acop Chart Display Events
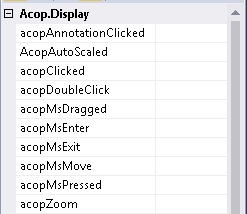
| acopAnnotationClicked occurs when a chart annotation has been clicked.
AcopAutoScaled occurs when a chart has been autoscaled.
acopClicked occurs when a chart has been clicked.
acopDoubleClicked occurs when a chart has been double-clicked.
acopMsDragged occurs when the mouse is being dragged over the chart.
acopMsEnter occurs when the mouse is moved into the chart
acopMsExit occurs when the mouse is moved out of the chart.
acopMsMove occurs when the mouse hovers over the chart.
acopMsPressed occurs when the mouse has been pressed on the chart.
acopZoom occurs when the acop chart is zoomed.
|
|
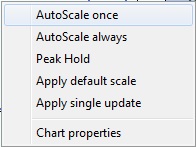
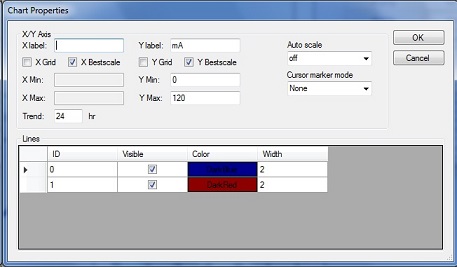
Acop Chart Context Menu Options
| Set Chart parameters at runtime via the context menu (just right-click on the chart)!
|
Fitting Examples ...
Various fitting algorithms and FFT analysis methods are providing within the ACOP chart. In addition to explicitly calling these methods in code, you also can configure your fitting wishes at design time, in which case the fitted plot will be displayed as well as the original data shown as the configured plot symbol.
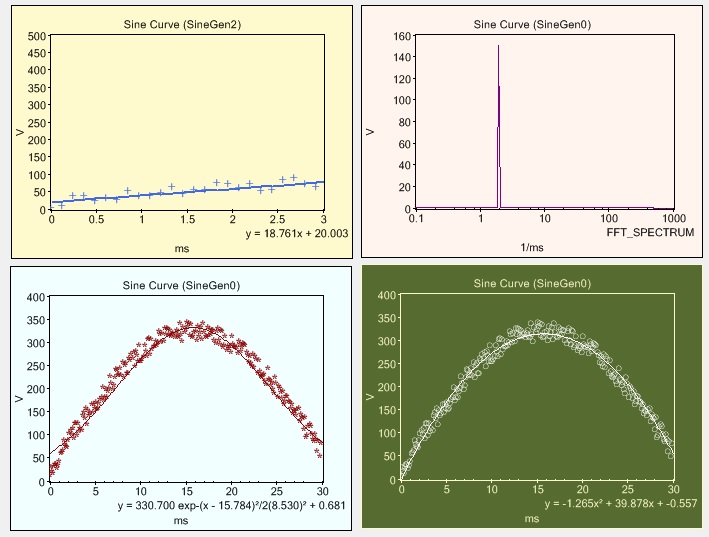
Acop Chart Curve Fits
The above fitting examples were obtained with the following relevant settings and without any additional coding. The resulting fitting parameters are of course easily obtainable in code if desired.
| Upper Left:
- BackgroundColor = LemonChiffon
- Fitting = LINE_FIT
- ForegroundColor = RoyalBlue
- PlotSymbol = '+'
| Upper Right:
- BackgroundColor = SeaShell
- Fitting = FFT_SPECTRUM
- ForegroundColor = Purple
- PlotSymbol = '+'
|
| Lower Left:
- BackgroundColor = Azure
- Fitting = GAUSSIAN_FIT
- ForegroundColor = DarkRed
- PlotSymbol = '*'
| Lower Right:
- BackgroundColor = DarkOliveGreen
- Fitting = PARABOLIC_FIT
- ForegroundColor = White
- PlotSymbol = '○'
|
The Next Level ...
Adding a bit of display logic is an easy matter. All components support events, GUI events such as Mouse Click or Mouse Move, as well as data transport events, such as Link Update or Apply. You can either provide your own delegate name for an event handler or simply double click on an event in the designer to receive a default delegate name, which will be the name of the component followed by the event, i.e. something like 'acopChart1_acopLinkUpdate' (assuming you have kept the designer default component name for a chart control).
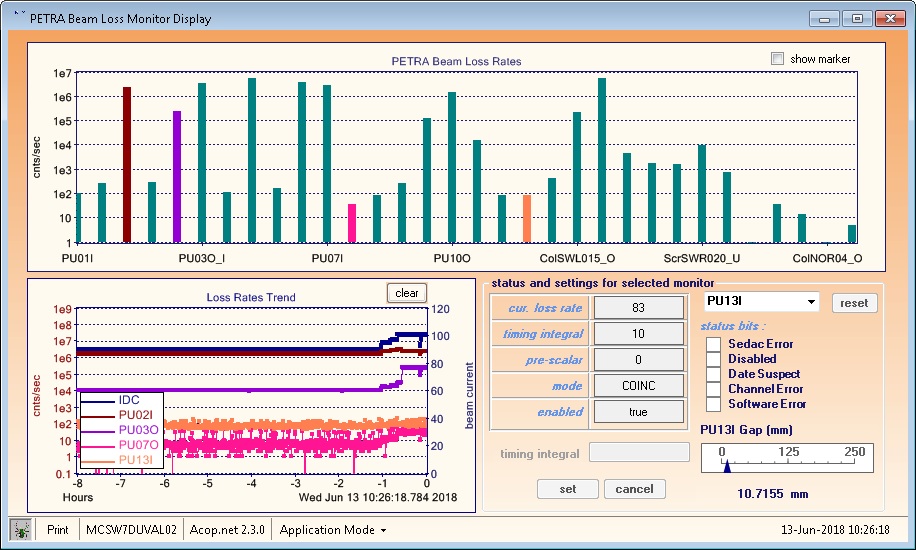
Suppose you have a chart display of multi-channel data displayed in a histogram plot. And suppose you have another chart which displays the trends of one of the channels.
Besides incorporating an AcopChooser you can as well allow the user to click on the channel he wants to trend in the histogram chart (acopChart1) and then add it to the trend chart (acopChart2).
Good practice would also be to supply a color list and tag the selected channels with its own color. The following example code (written in C#) does exactly this.
String[] tagColors = null;
String[] devices = null;
Boolean[] trend = null;
private void acopChart1_acopClicked(
object sender,
Acop.AcopChartUtil.AcopEvent e)
{
int idx = e.GetArrayIndex();
if (lnk == null) return;
if (idx < 0 || idx > devices.Length - 1) return;
if (trend == null) trend = new Boolean[devices.Length];
if (trend[idx]) return;
acopChart2.LinkServer = acopChart1.LinkServer;
acopChart2.LinkProperty = acopChart1.LinkProperty;
acopChart2.LinkDevice = devices[idx];
acopChart2.Attach();
trend[idx] = true;
if (tagColors == null)
{
tagColors = acopChart2.ForegroundColorList.Colors.Split(new char[] { ';' }, StringSplitOptions.RemoveEmptyEntries);
}
Color c = Color.FromName(tagColors[(coloridx++) % tagColors.Length]);
acopChart1.TagColor = c;
acopChart1.SetTagged(idx, true);
}