|
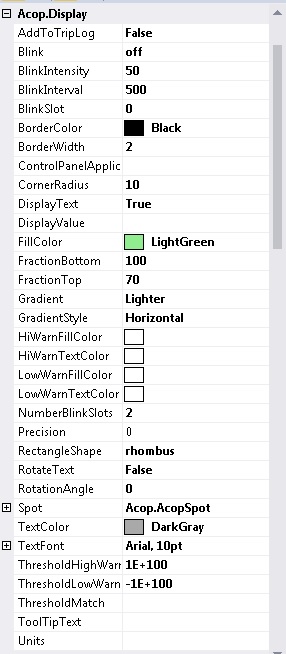
Acop Rectangle display Properties
| Blink set the mode for the rectangle shape
- off (default)
- onWarning
- always
BlinkIntensity set the blink intensity for the table cells (up to 100% lighter or -100% darker) (default = 50)
BlinkInterval set the blink interval (msec) for the table cells (default = 500)
BlinkSlot set the blink slot for the table cells (0 up to NumberBlinkSlots) (default = 0)
BorderColor border color of rectangle region
BorderWidth border width of rectangle region
CornerRadius corner radius of rectangle region
DisplayText if true: display input text/readback value on shape
DisplayValue if non-empty then the displayed value upon update will be the value given
FillColor background color of rectangle region
FractionBottom length in percent of the bottom leg of the rectangle shape
FractionTop length in percent of the top leg of the rectangle shape
Gradient color gradient for filled region
GradientStyle color gradient style for filled region
HiWarnFillColor color of display rectangle region when the readback value exceeds the high threshold
HiWarnTextColor color of display text when the readback value exceeds the high threshold
LowWarnFillColor color of display rectangle region when the readback value exceeds (negative direction) the low threshold
LowWarnTextColor color of display text when the readback value exceeds (negative direction) the low threshold
NumberBlinkSlots set the number of blink slots for the table cells (at least 2) (default = 2)
Precision precision to use for floating point numbers (0 = general display)
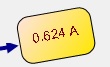
RectangleShape the shape of the drawn rectangle
- rectangle (default = classic right-angled box shape)
- rhombus
- trapezoid_right
- trapezoid_left
- parallelogram_right
- parallelogram_left
RotateText if true: apply rotation angle to displayed text
RotationAngle rotation angle of rectangle region
Spot parameters to acquire and display a spot on the synoptic display.
TextColor color of display text in rectangle region
TextFont font of display text in rectangle region
ThresholdHighWarn if the link data is numerical, then the threshold provided is used for comparisons with the monitored data
ThresholdLowWarn if the link data is numerical, then the threshold provided is used for comparisons with the monitored data
ThresholdMatch if non-empty and the link data is non-numerical, then the string provided is used for comparisons with the monitored data
ToolTipText specifies the preferred tooltip text for table. If un-specified, then the address parameters will be used.
Units the value units (applied to the component's description)
|
|
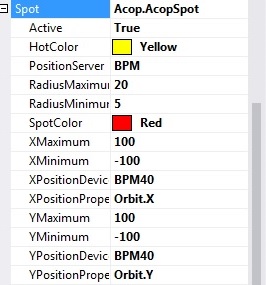
Acop Spot display Properties
| Active denotes whether the spot is actively accessing and displaying the given
HotColor is the color of the hot region of the spot
PositionServer is the server address containing the X and Y positions
RadiusMaximum is the maximum radius of the spot.
RadiusMinimum is the minimum radius of the spot.
SpotColor is the primary spot color
XMaximum is the maximum X position coordinates
XMinimum is the minimum X position coordinates
XPositionDevice is the device portion of the X position target address
XPositionProperty is the property of the X position target address
YMaximum is the maximum Y position coordinates
YMinimum is the minimum Y position coordinates
YPositionDeviceis the device portion of the Y position target address
YPositionProperty is the property of the Y position target address
|