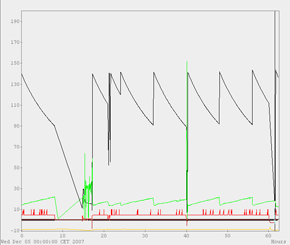

AcopChart is an extension of Acop which enables the use of ConnectionParameters and can connect to a remote property.
This chart can be used as a trend or histogram chart. The mode which is used can be selected by applying the appropriate AcopGraphParameters, which also specify other settable properties that concern a particular graph.
AcopChart also enables Drag & Drop, where AcopGraphParameters can be transferred to/from the chart using the standard mouse drag and drop.
The following lines show an example how to use the features of the AcopChart.
First we create an instance of the AcopChart object.
AcopChart chart = new AcopChart();
We require AcopGraphParameters which describe the remote property. Let's display a few graphs in this chart. First we need to define the connection point for each graph. This is done by constructing ConnectionParameters
ConnectionParameters cp = new ConnectionParameters("TINE", "context", "server", "device", "property", AccessMode.POLL, 1000);
These parameters describe a remote property context/server/device/property in the TINE control system. We will request a constant monitoring, therefore AccessMode.POLL was used. Polling rate is set to 1000 milliseconds, which means that value on the table will be updated every 1000 milliseconds. Now we make AcopGraphParameters. We will set the color of the graph to red, use no fft, and display data in the histogram with solid lines of width 2. We can set the fft, drawStyle and mode properties to any value included in the enumerations. The last two parameters describe that we don't intend to show trend.
AcopGraphParameters parameters = new AcopGraphParameters(cp, Color.RED, AcopFFTEnum.NoFFT.ordinal(), AcopDrawStyleEnum.PS_SOLID.ordinal(), AcopDisplayMode.SimpleHistogram.ordinal(), 2, false, 0);
Parameters are then attached to the chart. Connection is created automatically.
try {
        chart.addDisplayerParameters(parameters);
} catch (CommonException e1) {
        e1.printStackTrace();
} catch (PropertyVetoException e1) {
        e1.printStackTrace();
}
If no exception occurred, chart should show the remote value.
AcopChart is able to display multiple connections. We will construct new AcopGraphParameters for the same property and will use a converter for this graph. However now we don't want to show all devices in the multi-channel. We only want to show the first 20 device. This can be set by configuring ConnectionParameters (the last parameter in the constructor).
ConnectionParameters cp1 = new ConnectionParameters("TINE", "context", "server", "device",      "property", AccessMode.POLL, 1000, 20);
AcopGraphParameters parameters1 = new AcopGraphParameters(cp1, Color.BLUE, AcopFFTEnum.NoFFT.ordinal(), AcopDrawStyleEnum.PS_SOLID.ordinal(), AcopDisplayMode.PolyLine.ordinal(), 1, false, 0, new MultiplierConverter(2));
Here we used a MultiplierConverter which will multiply the value for a factor 2. This graph will be shown as the polyline.
try {
        chart.addDisplayerParameters(parameters1);
} catch (CommonException e1) {
        e1.printStackTrace();
} catch (PropertyVetoException e1) {
        e1.printStackTrace();
}
Now we want to display a trend line in the graph. We will construct new AcopGraphParameters with a trend length of 1000. This means that the graph will show 1000 points. When the number of points exceeds this number the first value will be removed.
AcopGraphParameters parameters2 = new AcopGraphParameters(cp, Color.BLUE, AcopFFTEnum.NoFFT.ordinal(), AcopDrawStyleEnum.PS_SOLID.ordinal(), AcopDisplayMode.PolyLine.ordinal(), 1, true, 1000);
It does not make sense displaying a histogram and trend on the same chart, therefore we have to remove all previous graphs. To remove a single parameters we can use the removeDisplayerParameters method.
chart.removeDisplayerParameters(parameters);
To remove all parameters at once, we can also use method setDisplayerParameters.
try {
        chart.setDisplayerParameters(new AcopGraphParameters[]{parameters2});
} catch (CommonException e1) {
        e1.printStackTrace();
} catch (PropertyVetoException e1) {
        e1.printStackTrace();
}
When adding parameters to the chart, chart will adjust the vertical boundaries with the values which are read from the remote property information. We are not sattisfied with this values and want to set different boundaries.
chart.setYMax(30);
chart.setYMin(-30);
Another option is to allow the chart to adjust its boundaries by itself for best visualization.
chart.setYBestScale(true);
chart.setXBestScale(true);
We can also enable horizontal and or vertical grid
chart.setXGrid(true);
chart.setYGrid(true);
And if we aren't satisfied with the looks of the grid, we can customize it. We can set it's color, the width of grid's lines and also the type of lines
chart.setGridColor(Color.WHITE);
chart.setGridWidth(2);
chart.setGridStyle(AcopDrawStyleEnum.PS_DASH_DOT.ordinal());
And finally, if we want, we can change the background color of the chart:
chart.setBackground(Color.BLACK);
See the complete source code used in this examples.